Mail logs collected from November 2005 to January 2006 were recently analyzed to determine whether the recent email-server upgrade was adequate, given the increased volume of email being processed. A side-benefit of this analysis provided an accounting of how much of the email being processed by the server, is actually spam.
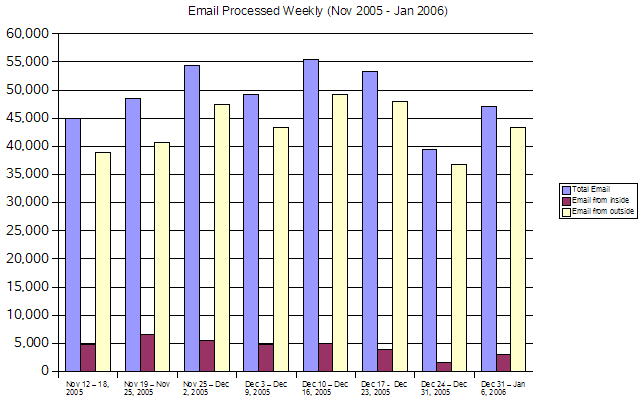
A comparison between email sent and received.
Spam is the term given to any unsolicited email that promotes some commercial venture. According to a report published by Symantec, 61% of email was spam; at the beginning of 2005, the top three countries originating spam were the U.S. (51%), South Korea (14%), and Canada (7%).
The main method used by the Department to combat spam is SpamAssassin— a suite of plugins for the mail delivery program that scans incoming email to see if the content of the message matches known spam "signatures" and tags matching email so the user can ultimately decide what to do with the message.
“An average of 71% of incoming email
processed by the Department email server, is spam.”
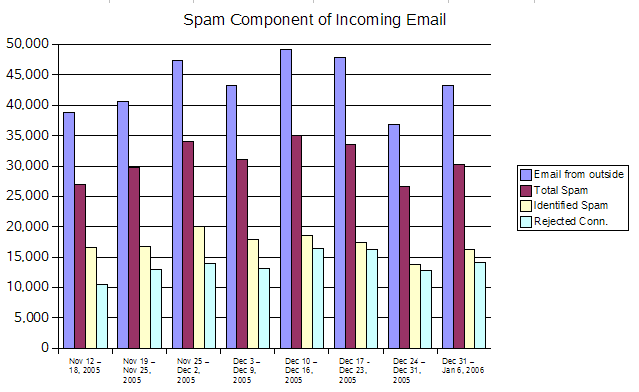
A comparison between the total amount of email and the total amount of spam.
During a typical seven day period, the Department email server processes an average of 49,000 email messages. This includes an average of 4,000 messages that are sent from within the Department and approximately 40,000 emails that originate from outside the Department.
Of the 40,000 email messages received, an average of 17,000 are identified and tagged as spam and delivered to the intended recipient. In addition, an average of 14,000 emails are rejected by the server because they originate from black-listed sites (as designated by the Spamhaus collective).
Calculations show that an average of 71% of the incoming email processed by the Department email server, is spam. A similar analysis performed in 2004 showed that 27% of incoming email was spam and the total volume of email processed by the server averaged about 32,000 messages per week during that period.
It is notable that during the week of the Christmas break (Dec. 24 - Dec 30, 2005), the outgoing department email dropped by more than 50% (only 1,690 messages were sent), the change in incoming email was negligible; evidently, spammers do not take a holiday.
| DATE | EMAIL MESSAGES | SPAM (%) | |||
|---|---|---|---|---|---|
| TOTAL | INCOMING | OUTGOING | SPAM | ||
| Nov 12 – Nov 18, 2005 | 44,907 | 38,837 | 4,785 | 26,919 | 69 |
| Nov 19 – Nov 25, 2005 | 48,537 | 40,689 | 6,612 | 29,675 | 73 |
| Nov 26 – Dec 2, 2005 | 54,406 | 47,373 | 5,496 | 34,004 | 72 |
| Dec 3 – Dec 9, 2005 | 49,298 | 43,343 | 4,890 | 31,072 | 72 |
| Dec 10 – Dec 16, 2005 | 55,365 | 49,131 | 4,983 | 35,019 | 71 |
| Dec 17 – Dec 23, 2005 | 53,217 | 47,952 | 3,992 | 33,591 | 70 |
| Dec 24 – Dec 30, 2005 | 39,485 | 36,835 | 1,690 | 26,627 | 72 |
| Dec 31 – Jan 6, 2006 | 47,097 | 43,273 | 2,963 | 30,296 | 70 |
Notes:
- All email with a foreign address (not matching "@ee.ryerson.ca") was classified as being "from outside".
- Total spam included both email identified as spam and rejected connections. A rejected connection was treated as spam because it required processing and a Spamhaus lookup.
- Spam calculations only used email that did not originate from within the Department.
- Email destined to multiple recipients was treated as a single email. So the total volume of email processed was, in fact, slightly larger than reported.
- The default spamassassin threshold is set at 4.5; individual users can lower this threshold and can configure their account so that all tagged email above the threshold is automatically deleted without being delivered to their spam folder.
- Spamhaus servers regularily undergo denial-of-service attacks from black-listed sites to prevent database updates from being downloaded, thus allowing spam to be received by email servers relying on the Spamhaus service.